Introduction
This was mostly written during December 2020, but never published.
Warning: minor spoilers to day 10 of advent of code 2020.
I’m doing Advent of Code 2020 for the first year. I’m having a great time and the puzzles provide a good challenge at the end of the day.
I particularly enjoyed day 10 and I wanted to write a little about the puzzle.
The Puzzle
If you follow the link in the previous paragraph you can read the first part of the puzzle specification1. The second part is to take this big list of adapters and find all the possible ways of connecting them such that you get from 0 jolts up to your device’s rating. The only issue is that adapters can only be connected to another one if the second adapter is rated between the same joltage and +3 jolts from your current adapter.
In the puzzle itself, you get a huge amount of adapters so you need a computer to enumerate the possibilities. I got a list of 108 different adapters.
The First Attempt
Faced with this problem, I thought I’ve effectively got to do a tree-search of all the possible combinations. I wrote a simple recursive function and tested it against the example data provided in the puzzle. It gave the right answers so I set it running on the input data. It was taking a little while so I started doing something else.
When I get back to my laptop, it’s still running and I realise that I’ve skimmed over the puzzle text too quickly and missed the very obvious hint:
there must be more than a trillion valid ways to arrange them! Surely, there must be an efficient way to count the arrangements.
There must be an efficient way to count the arrangements—but I wasn’t using it.
The Breakthrough
I only made a breakthrough in my understanding of how to tackle this problem when I plotted the data.
The problem readily lends itself to graph-based techniques: An adapter rated for 4 jolts can only connect to adapters rated for 4, 5, 6, and 7 jolts. It cannot connect to an adapter rated for 8 jolts. So if each node on the graph is an adapter, the edges connect adapters that can come in sequence.
library(tidyverse)
library(tidygraph)
library(ggraph)
library(igraph)
library(patchwork)

# The puzzle text said that our device is rated for 3 jolts more than the
# highest adapter in our bag
get_device_rating <- function(adapters) {
  max(adapters) + 3
}

# This function makes a graph that specifies which adapters can be used
# with which other adapters
make_graph <- function(jolts) {
  get_candidates <- function(current_joltage, adapters) {
    adapters[(adapters - current_joltage) <= 3 & (adapters - current_joltage) > 0]
  }

  jolts_df <- tibble(name = jolts)

  jolts_edges <- jolts_df %>%
    mutate(to = map(name, get_candidates, name)) %>%
    unnest_longer(to) %>%
    filter(!is.na(to)) %>%
    rename(from = name) %>%
    mutate_all(as.character)

  tbl_graph(nodes = jolts_df %>% mutate_all(as.character), edges = jolts_edges)
}

# helper function to load the data
load_jolts <- function(path) {
  jolts <- sort(as.numeric(readLines(path)))
  jolts <- c(0, jolts, get_device_rating(jolts))
}


# plotting
plot_graph <- function(graph) {
  ggraph(graph, layout = "igraph", algorithm = "gem") +
    geom_edge_link(aes(start_cap = label_rect(node1.name),
                     end_cap = label_rect(node2.name)),
                   arrow = arrow(length = unit(0.2, "cm"), type = "closed")) +
    geom_node_text(aes(label = name)) +
    theme_void()
}
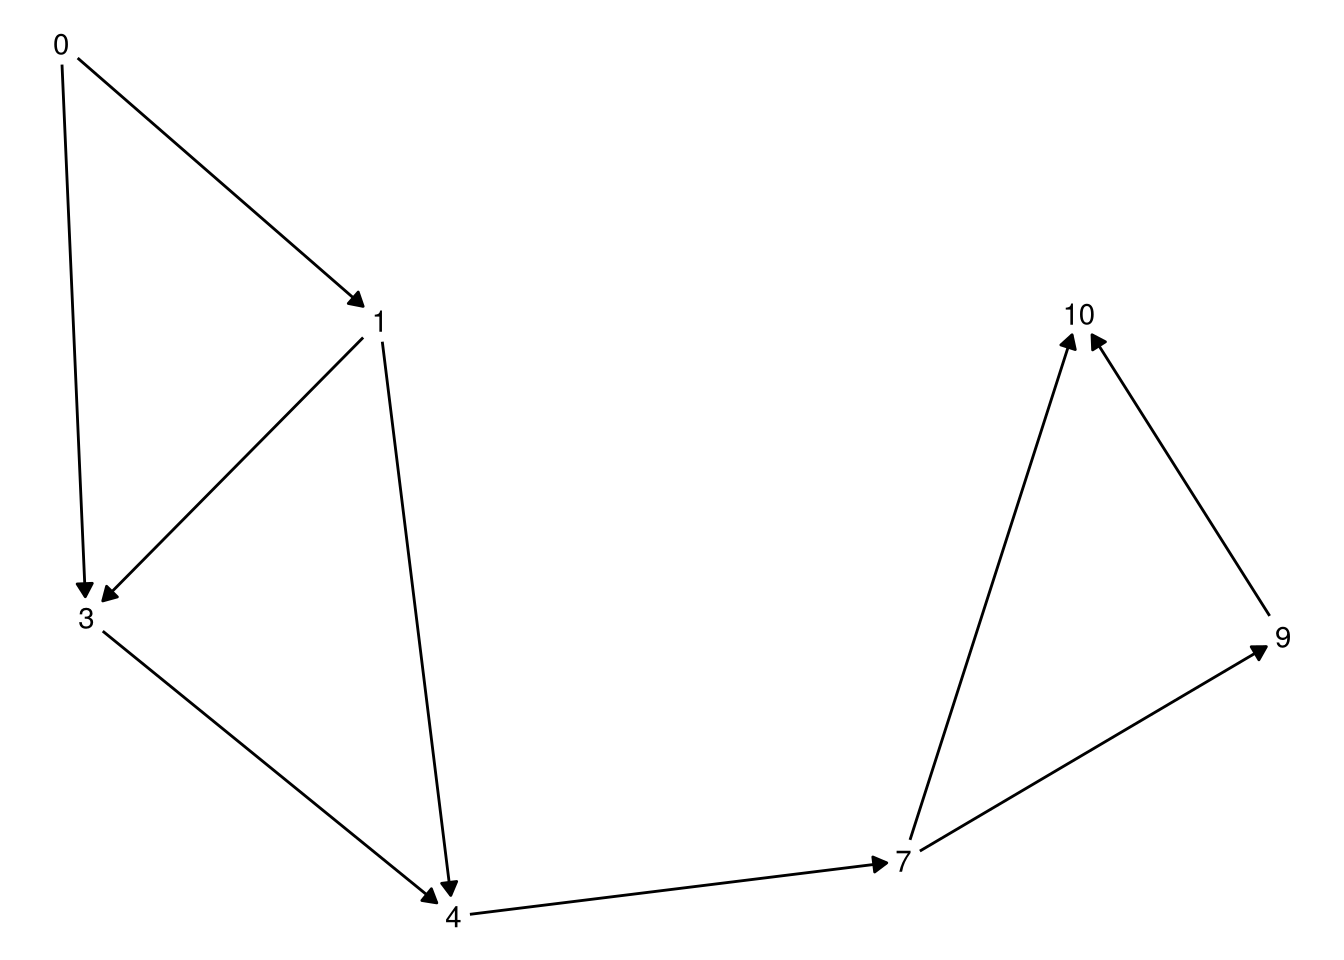
little_jolts <- c(0, 1, 3, 4, 7, 9, 10)For example, say we had a a bag with adapters with joltages 0, 1, 3, 4, 7, 9, and 10. We’d end up drawing a graph like:
little_jolts %>%
  make_graph() %>%
  plot_graph()
The 0 jolt adapter can connect to only the 1 jolt or the 3 jolt adapter (so there are connecting lines), but can’t connect to any others.
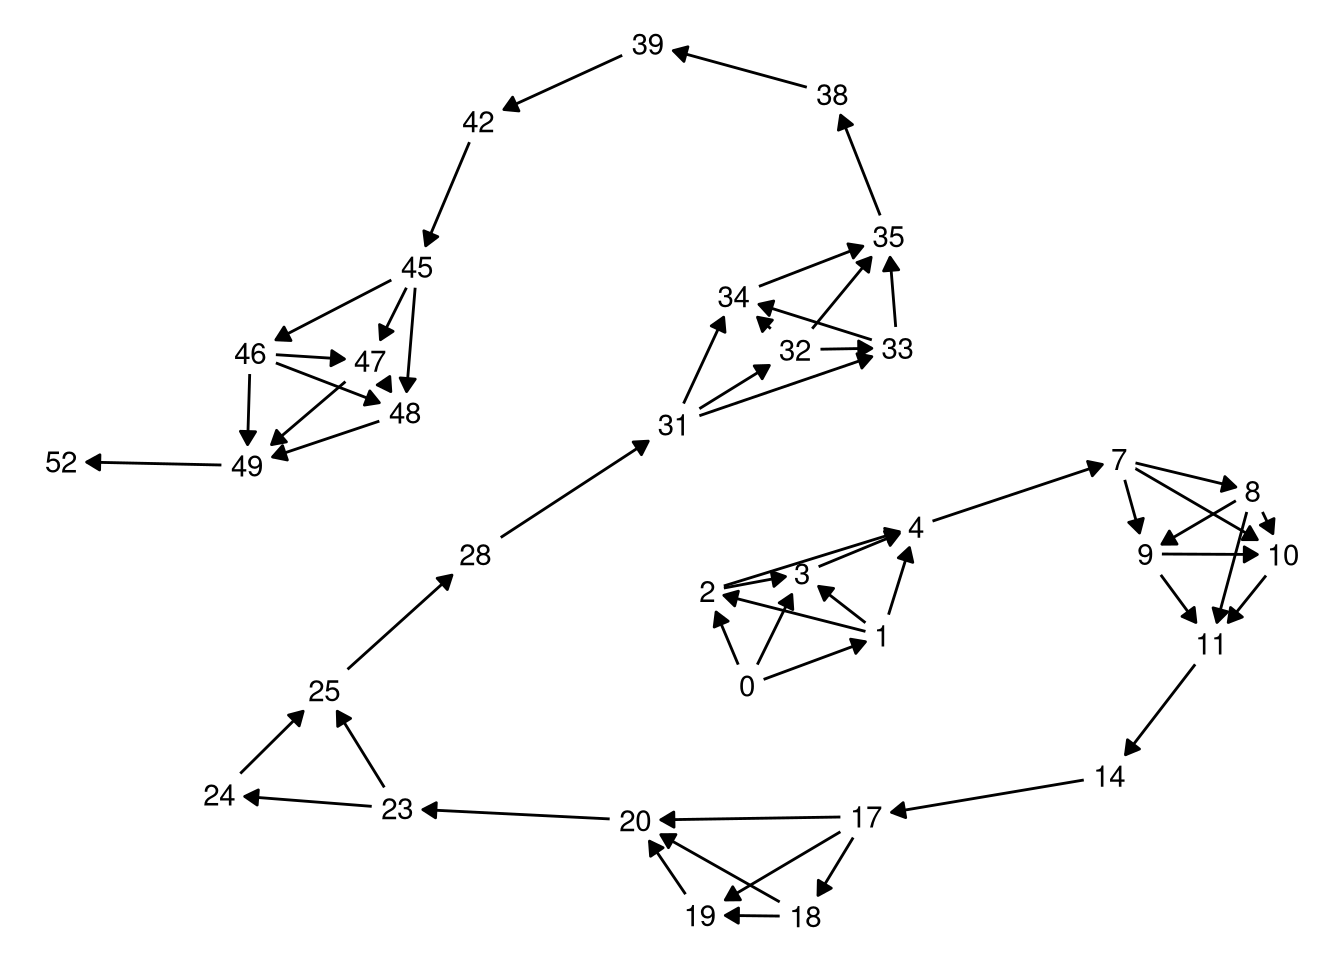
Here’s a similar graph for the test input:
jolts <- load_jolts("./10_test_2.txt")
jolt_graph <- make_graph(jolts)

plot_graph(jolt_graph)
Much more complicated, but this provided my breakthrough.
I needed to count all the possible ways of getting from 0 so 52—all the different routes through. The key insight here is that the graph isn’t that densely connected.
In fact, there are notable separate sub-graphs where there’s a lot going on but these are separated by one or more single edges.
For example, 0 to 4 has loads of possible routes, but there is only one way to get from 4 to 7. No matter how you get from 0 to 4, you will always only have one way to get to 7.
The smaller islands of activity are independent.
We can break the problem down into solving smaller sub graphs and then combining these together because we know there is only one way to get between successive sub graphs.
So let’s look at some graphs that we may encounter and count the number of ways through them.
# helper to make a graph from 1 to `max`, connecting nodes that are `diff`
# apart.
make_subgraph <- function(max, diff = 3) {
  nodes <- tibble(name = 1:max)
  edges <- tibble(from = 1:max,
                  to = map(from, ~.x + 1:diff)) %>%
    unnest(to) %>%
    filter(to <= max)

  tbl_graph(nodes = nodes, edges = edges)
}
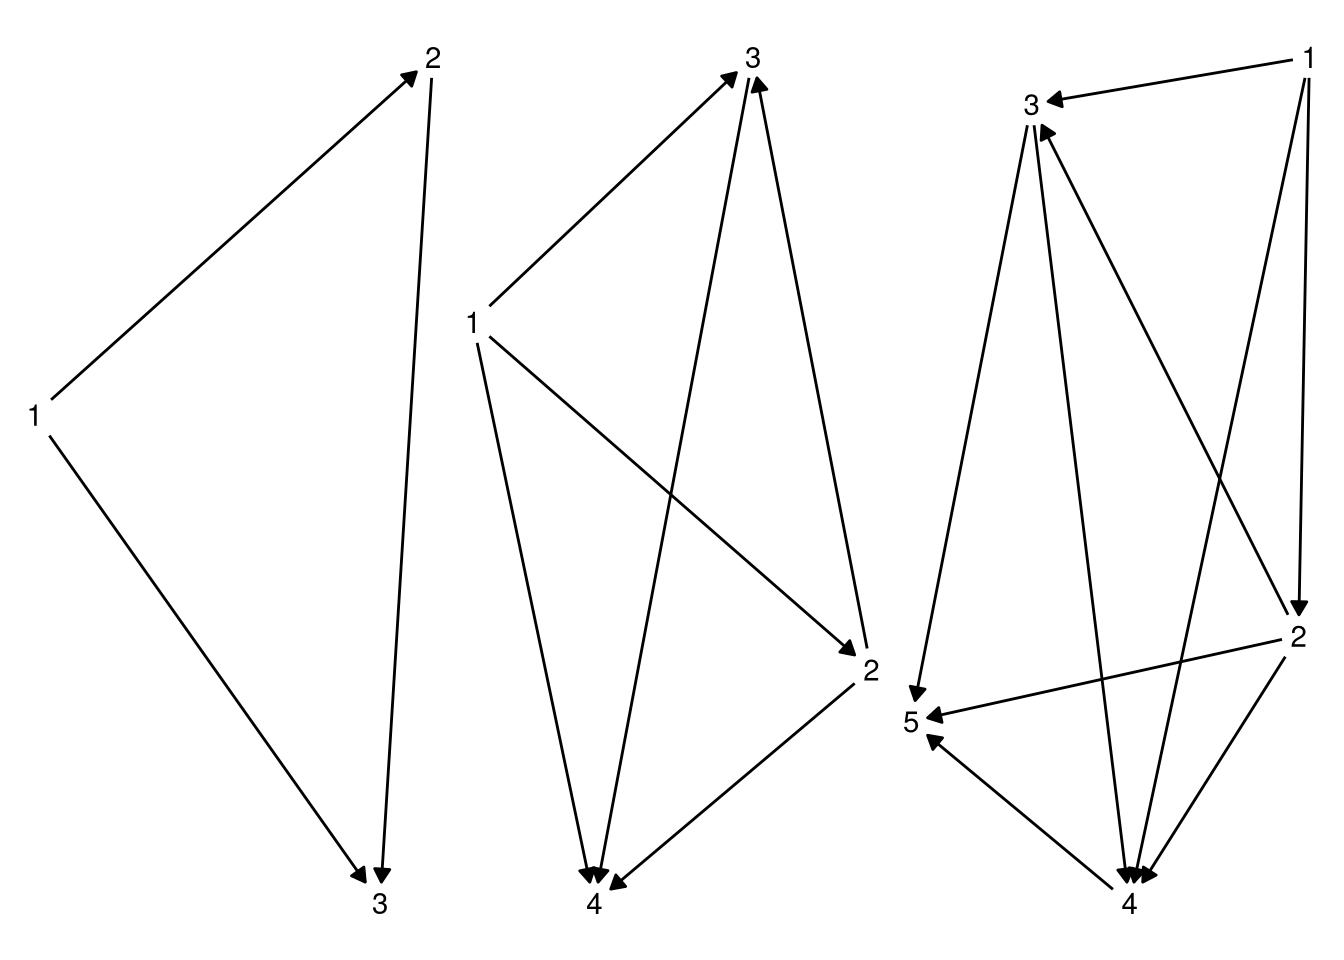
If we’re only dealing with 3, 4, or 5, sequential adapters, we get one of the following graphs:
g <- map(3:5, make_subgraph) %>%
  map(plot_graph) %>%
  reduce(`+`)

g
So the really, we just need to enumerate the possible ways of traversing these sub graphs, and then identify each in the big graph.
This vastly reduces the problem, the solution of the problem isn’t the topic of this post though.
Always Plot Your Data
That’s the topic of this post.
You have, on your shoulders, the most powerful pattern recognition platform there is. There is no substitute to just looking at your data.
Plotting is the closest we can come to picking up data and looking at it from different angles. Until you draw out your data, is it really your data?
Afterword
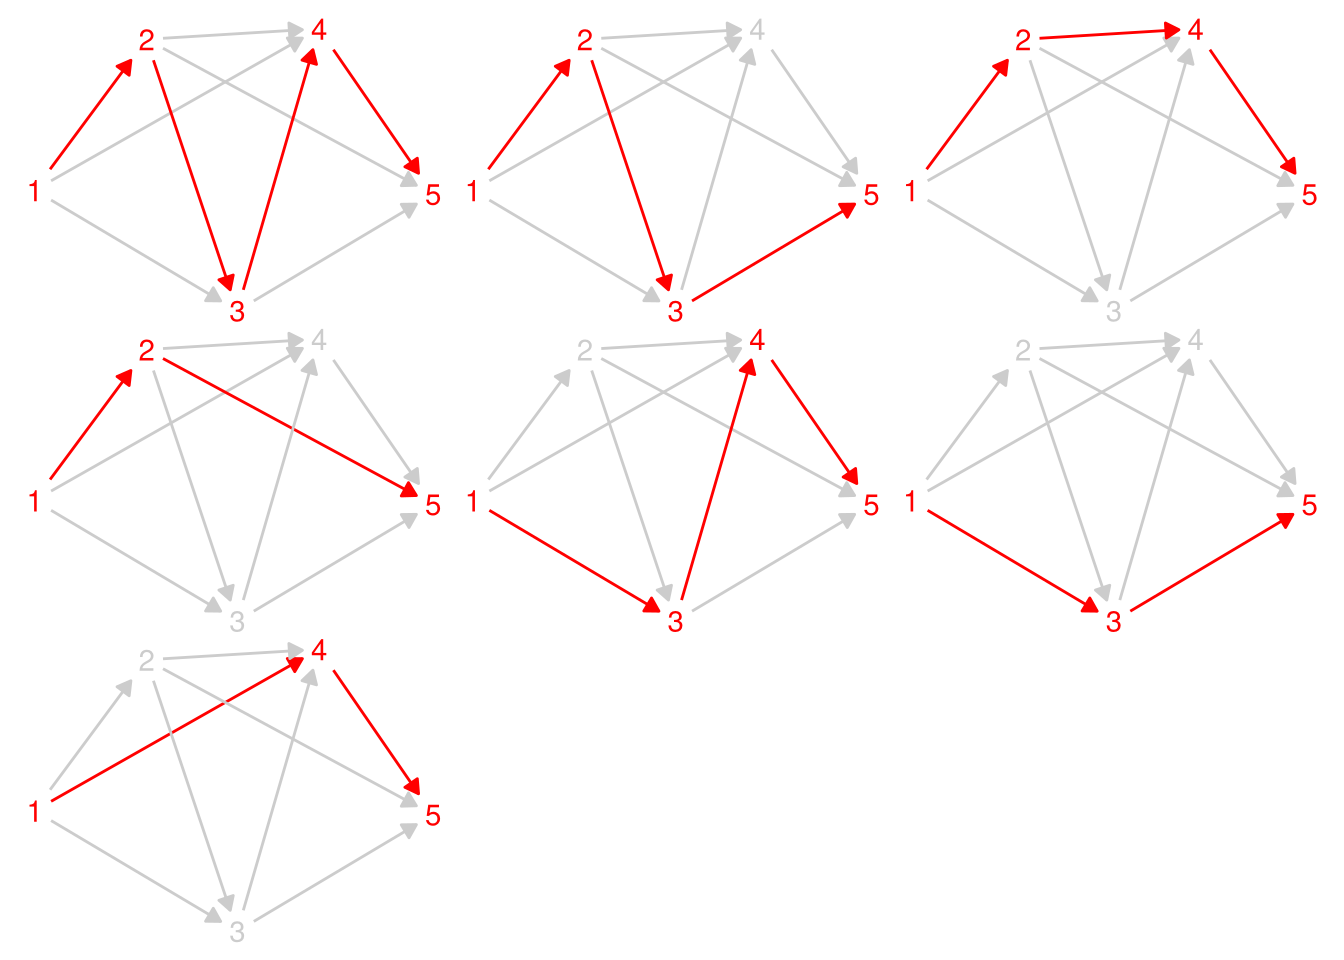
Just in case you were interested, here are all the routes through the graph of five nodes:

or play through advent of code and you can read the whole thing.↩︎